.webp)


2.8k+
30,000+
12k+
40+
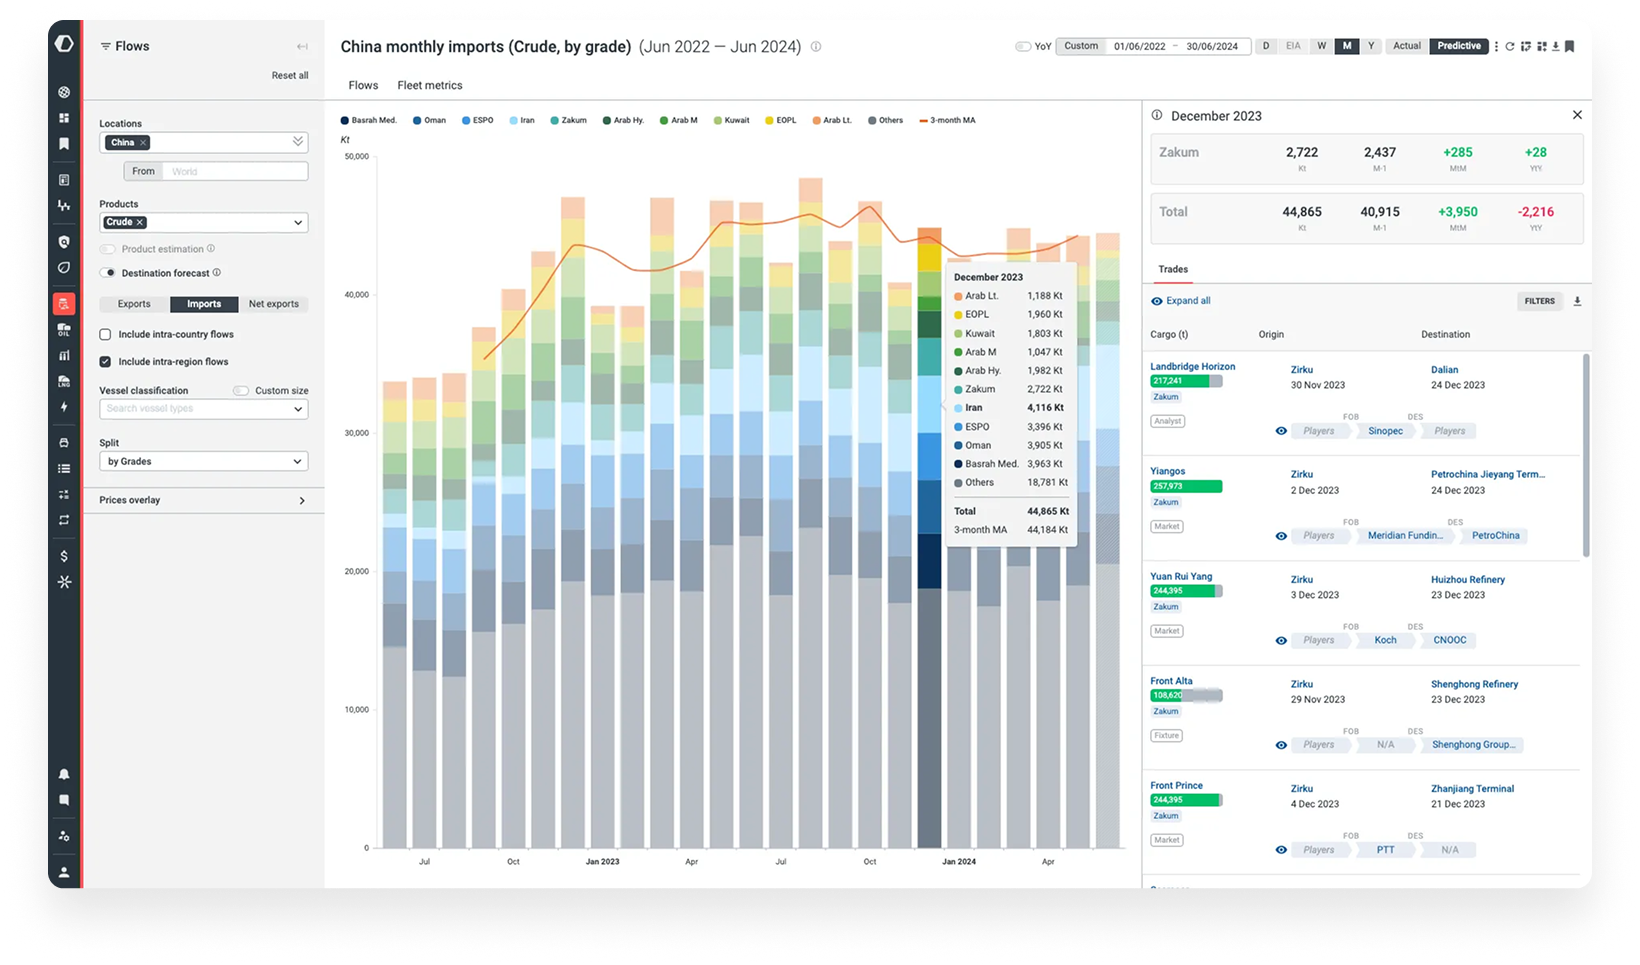
Ensure global real-time visibility for 40+ commodities with thoroughly backtested volume, product, and grade data to capture shifts in regional supply & demand and enable emerging trade opportunities before the rest of the market.
Follow competitor markets with buyer, seller, fixture, charter, and vessel ownership insights to optimize trade & arbitrage strategy. Optimize trades by accessing accurate LNG and crude inventories to ensure that you act ahead of market shifts.
Gain 18 month forecasts and short term market calls from an expert, unbiased research team and receive guidance in the form of daily, weekly, and monthly reports along with customized meetings to help answer your specific market needs.
.webp)
Tap into price & balance forecasts with long-refined supply & demand models across crude oil, refined products, LNG & natural gas, coal, grains, biofuels, and iron ore driven by proprietary data to identify market imbalances and take advantage.
Receive daily insight into 900+ refineries including runs by crude quality and grade, refined product production, secondary unit feed input, gross margins, capacities and events to predict where crack margins will move and how global refined product markets are interacting.
Strike when cross-commodity market opportunities emerge by using a powerful analytics platform that enables analysis across commodity fleets and markets, to perform tasks such as analyzing the impact of coal and LNG on the power sector for a particular region or country or evaluating how demand for oilseeds is affecting the supply of vegetable oil and biofuels.
.webp)
Use detailed installation level import/export data featuring comprehensive buyer and seller data to enable granular analysis of specific assets, such as seaborne refineries, or mining installations, and evaluate net balances and associated prices to understand corporate performance.
Observe detailed stock changes for crude oil, both in-tank/installation and floating storage, within key regions to compose the supply picture. LNG utilization, capacity, and inventory data empower market analysts with a comprehensive view of LNG stock levels, terminal activity, and production efficiency for highly detailed supply analysis.
.webp)
Monitor critical freight & flow data in combination in order to comprehend pivotal interconnected pricing factors.
Observe canal congestion and gain data on waiting times and vessel counts for cargo at ports and installations.
Identify freight market indicators using freight utilisation data to identify supply & demand within vessel classes and understand regionally where demand is pulling ballast vessels in order to stay ahead of freight rate impacts.
.webp)
Use a colorful and intuitive live map that allows you to pinpoint any vessel and cargo instantly.
Tap into a cargo analytics workspace that enables analysts to cut data precisely as they need with splits across destinations, origins, buyers, sellers, routes, products, grades and more.
Stay on top of critical regional flows, routes, inventories and installations and setting up alerts and bookmarks to be notified of any critical events such as canal crossings.
.webp)
Access complete vessel compliance screening on one platform reducing tedious manual investigations. Get daily updates on sanctioned vessels and sanctioned entities to avoid being associated with illicit activity. Monitor sanctioned cargo movements across 40+ commodities that may put your business at risk.
.webp)
Review historical risk assessments since 1st January 2022 for informed decision making.Ensure you are working with IACS certified vessels to enhance market reputation and trading opportunities. Uncover the multiple ownership layers of vessels and identify those not insured by Protection and Indemnity (P&I) providers. Check the vessel’s ISM manager and evaluate vessel reliability and compliance history with Port State Control inspections.
.webp)
Leverage the world’s largest AIS network to observe vessel operations. Gain full visibility into ship-to-ship transfers of sanctioned cargo and any port calls within sanctioned countries attempting to conceal the origin or destination of cargo in circumvention of sanctions. Be alerted when vessels deviate from usual trade lanes which may constitute a breach in the contract of carriage. Detect AIS gaps and AIS spoofing that could be linked to deceptive shipping practices.
.webp)


.webp)
FAQ
Kpler provides real-time visibility across 40+ commodities with global trade flows, inventory levels, regional supply-demand imbalances, and 18-month forward forecasts—letting you spot price differentials and emerging trade windows before competitors. Combined with backtested volume, grade, and product data, you can accurately model opportunities and size positions with confidence. Expert market calls and daily/weekly research keep you ahead of shifting supply-demand dynamics, while competitor intelligence on buyers, sellers, and fixtures helps you optimize your strategy based on what the market is actually doing, not what you expect it to do.
Kpler delivers installation-level import/export data, detailed inventory tracking (in-tank, floating storage, LNG terminals), refinery operations across 900+ facilities (crude runs by grade, production, margins, capacities), and comprehensive buyer/seller intelligence for specific assets. You can observe stock changes across regions, monitor LNG utilization and efficiency, and analyze supply pictures with granularity competitors can't match. This level of detail enables you to build accurate supply-demand balances, evaluate corporate performance, and forecast market moves with conviction backed by actual operational data, not estimates.
Kpler combines critical freight and flow data with vessel tracking, canal congestion monitoring, and waiting time analytics to reveal the interconnected factors driving freight rates. You can identify freight market indicators by analyzing vessel class supply/demand and observe where ballast demand is pulling vessels regionally—signals that precede freight rate moves. By staying ahead of freight bottlenecks and understanding cargo flows tied to specific routes and ports, you can optimize shipping costs, anticipate rate changes, and incorporate freight economics into your trading decisions with actual market data rather than lagging spot quotes.
Kpler provides unified sanctions screening across vessels and cargo, with daily updates on sanctioned entities and continuous monitoring of cargo movements across 40+ commodities. You can perform comprehensive due diligence—reviewing historical risk assessments, validating IACS certification and P&I insurance, uncovering ownership layers, and checking ISM manager compliance. The platform detects deceptive practices like ship-to-ship transfers of sanctioned cargo, port calls in sanctioned countries, AIS spoofing, and unusual trade lane deviations—reducing compliance risk and protecting your firm's reputation with a single source of truth rather than fragmented manual checks.
Kpler provides intuitive, real-time analysis tools: an interactive live map for pinpointing vessels and cargo instantly, a cargo analytics workspace for precise data cuts by destination, origin, buyer, seller, route, product, and grade, and alert/bookmark systems for monitoring critical flows and installations. Rather than spending hours building spreadsheets and manual analyses, you can configure data exactly as you need it and set up real-time alerts for critical events like canal crossings or inventory shifts. This efficiency gain means your team spends time on strategy and execution rather than data gathering—a significant competitive advantage in fast-moving markets where speed matters.