Kpler provides financial professionals with trade flow, vessel tracking, and commodity market intelligence. Kpler datasets enable actionable analysis, alpha generation, and informed decision-making for portfolio managers, analysts, quantitative traders and more.


.webp)


2.8k+
480+
19k+
40+
Evaluate publicly traded companies using Kpler’s detailed trade flow, crude quality, grade, refinery runs, production, and secondary unit input data mapped to publicly traded companies. Analyze crack margins, company performance, and operational efficiency in real time for actionable investment insights.
.webp)
Leverage Kpler’s iron ore cargo tracking intelligence and data to identify major export installations operated by publicly traded mining companies. Follow exports and production against quarterly guidance to gain a competitive edge in analysis and earnings forecasting.
.webp)
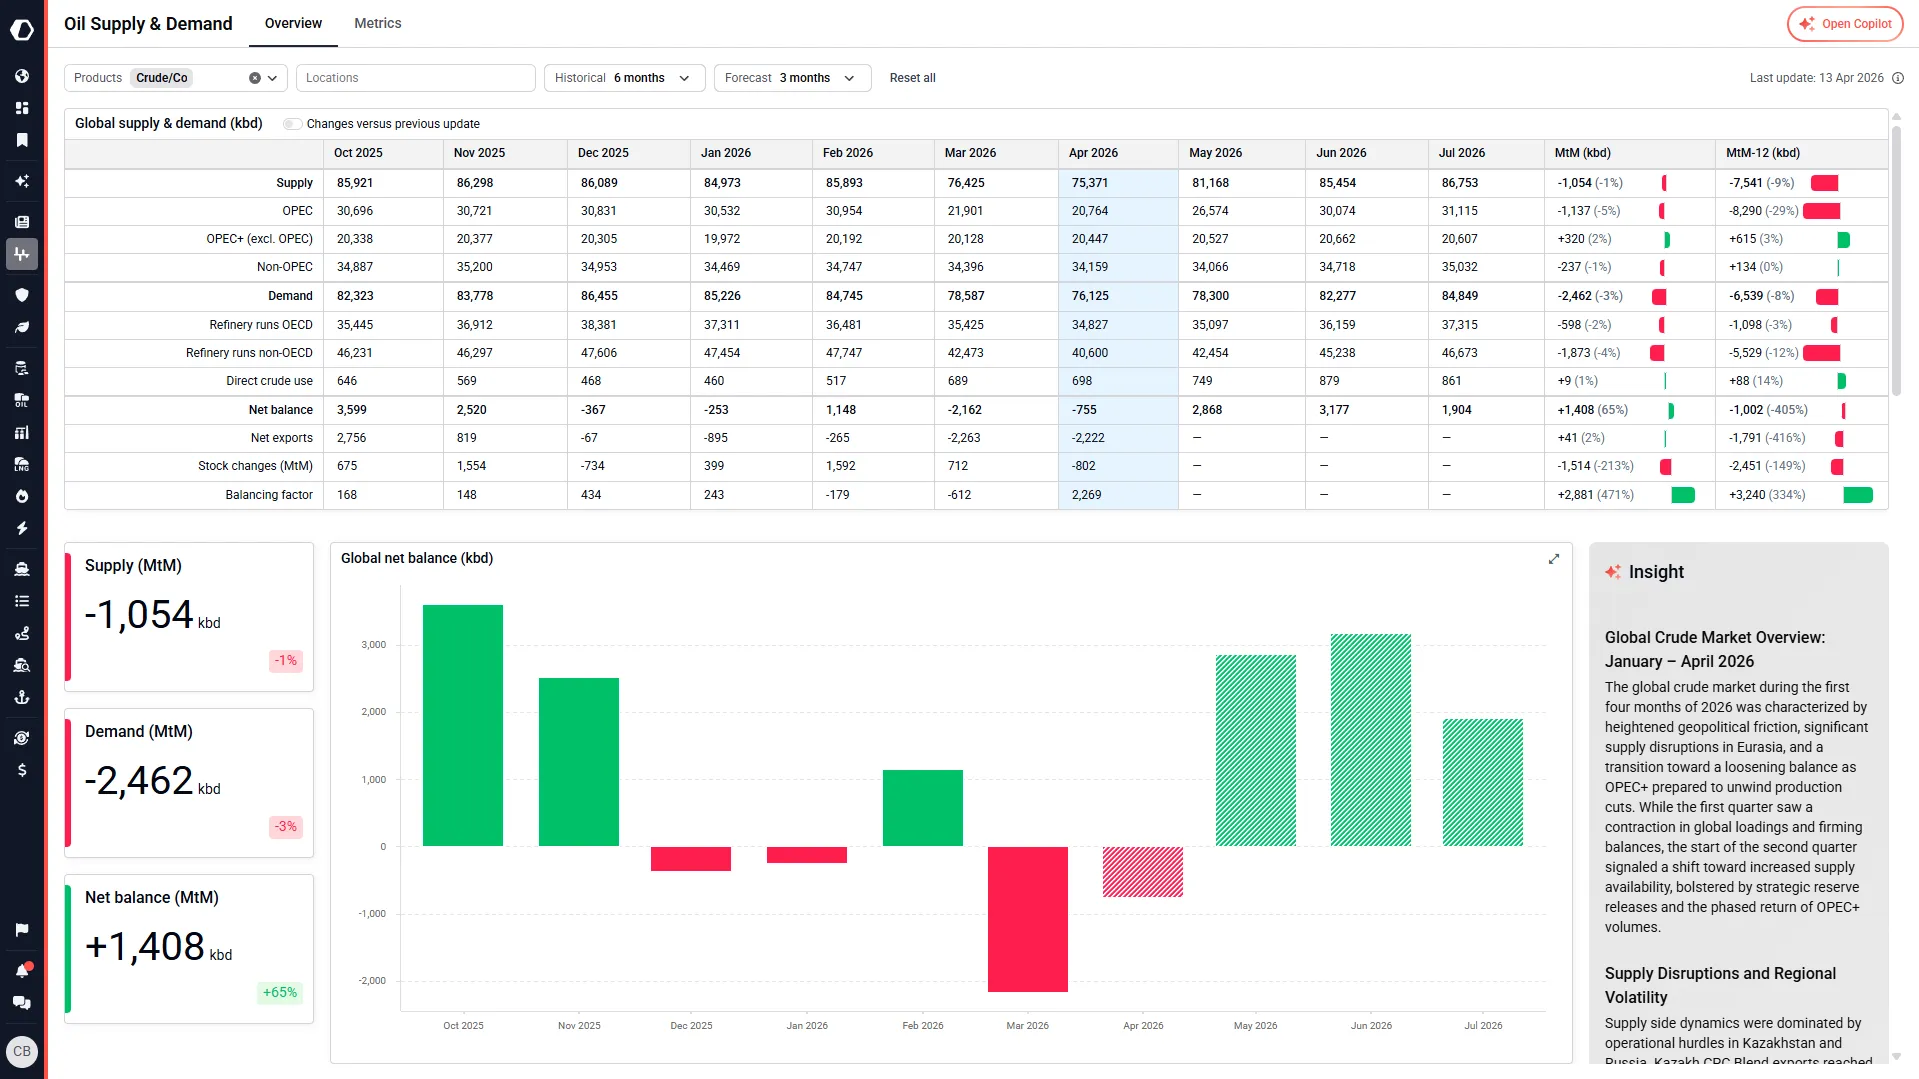
Decipher macroeconomic trends with supply and demand data across fundamental commodities, including crude oil, LNG, coal, and iron ore. Model global consumer behavior and market health using Kpler’s S&D datasets to anticipate shifts in commodity and equity markets.
.webp)
Utilise Kpler’s buyer/seller mapped commodity market data across crude oil, refined products, LNG and dry bulk products to underpin analysis on quarterly outcomes for publicly traded firms in the energy sector, as well as adjacent sectors.
.webp)
Save time looking across various public and private sources to collate real-time data about global commodity trade flows with Kpler’s easy-to-use platform and capacity to create custom dashboards, bookmarks, and alerts to ensure that you easily monitor everything from individual vessels to entire regions.
.webp)
Tap into Kpler’s significant 15+ year history along with data on buyers and sellers involved within trades in order to create accurate seasonal analysis across major commodity markets and regions to identify discrepancies within seasonal trends and take action.
.webp)
Integrate high-frequency trade flow and inventory data via Kpler APIs to enhance predictive models. Detect supply-demand imbalances, forecast commodity and equity prices, and capitalize on market inefficiencies for high-frequency trading.
.webp)
Use Kpler’s cloud database, fully compatible with Snowflake, to gain direct access to comprehensive historical and live commodity market datasets enabling traders to perform deep statistical analysis on market trends, backtest trading strategies with extensive historical data and execute high-frequency trading with up-to-the-minute data.
Implement statistical arbitrage, pairs trading, or correlation-based strategies using Kpler’s real-time commodity datasets. Gain insight into price forecasts for Brent, WTI and other benchmarks and combine them with underlying fundamentals, to identify deviations and execute informed trades.

“Kpler is one of the few truly objective research outfits. No agenda, just data-driven insights.”


.webp)
FAQ
Kpler maps detailed operational data—crude quality, refinery runs, production, crack margins, iron ore exports—directly to publicly traded companies, enabling you to analyze company performance and efficiency in real time. Rather than waiting for quarterly earnings announcements, you can track refinery utilization, production levels, and export activity against guidance continuously. For portfolio managers, this enables early detection of underperformance or upside surprises; for equity traders, it provides signals to adjust positions before the broader market reacts. Combining operational metrics with financial analysis creates a competitive edge in earnings forecasting and stock price prediction.
Kpler's comprehensive supply-demand datasets across crude oil, LNG, coal, iron ore, and other fundamentals enable you to decipher macroeconomic trends and model global consumer behavior. By tracking actual trade flows, inventory levels, and production activity—not just financial indices—you can anticipate shifts in commodity prices and downstream equity valuations. With 10+ years of historical data combined with buyer/seller information, you can identify seasonal patterns, regional dynamics, and structural market changes. This fundamental perspective transforms equity analysis from financial metrics alone into comprehensive understanding of the underlying physical markets driving commodity-exposed companies.
Kpler's APIs provide high-frequency trade flow, inventory, and supply-demand data that you can integrate directly into predictive models for statistical arbitrage, pairs trading, and correlation-based strategies. Rather than relying on delayed financial data, you access real-time signals of supply-demand imbalances, inventory shifts, and trade flows that often precede price movements. By combining these fundamental datasets with price forecasts for benchmarks like Brent and WTI, you can identify deviations from fair value and execute informed trades. The high-frequency nature of this data enables quant strategies that traditional fundamental analysis can't capture.
Kpler's cloud database is fully compatible with Snowflake, providing direct access to comprehensive historical and live commodity datasets for deep statistical analysis and strategy backtesting. You can access 10+ years of historical trade flows, inventory data, and operational metrics to validate strategies across multiple market cycles and stress scenarios. This enables rigorous backtesting with extensive historical data before deploying capital, and execution of trades with up-to-the-minute data. The combination of deep historical context and real-time datasets ensures your strategies are validated against real market behavior while trading on current information.
Rather than collating data across multiple public and private sources, Kpler's unified platform provides real-time global commodity trade flows with intuitive dashboards, custom bookmarks, and alerts. You can monitor individual vessels, regions, or entire markets with a few clicks—dramatically reducing research time while improving data accuracy. The 10+ year history combined with buyer/seller data enables confident seasonal analysis and historical context. For financial analysts advising on energy sector valuations or adjacent industries affected by commodity prices, this efficiency gain means more time for strategic analysis and less time on data gathering—improving research quality and supporting faster decision-making.