Observing freight market trends with Kpler's data
Kpler features a wide variety of data, not only serving commodity market professionals and analysts, but also those within the freight market such as charterers, brokers, and professionals within ship owning firms. Similar to commodity trading and market professionals, Kpler surfaces real-time data that helps them to connect fundamentals with price and actually look to combine information about both trade flows and freight in order to unlock key insight to help plan and make decisions about the market.
This week, we are going to look into some elements of the Dry freight market to understand how Kpler is able to help its customers in the freight market navigate decision making through evaluating interconnected regional and global dynamics.
Recently capesize rates have been falling. This week the the round-voyage rate plunged by $6,286/day w/w to $15,071/day, and capesize rates falling to a near two month low. This is due to a culmination of factors, several of which we can identify and follow with Kpler’s data.
First, market professionals can gain a sense of chartering activity by looking at Kpler’s fleet utilisation data, which provides real-time data into vessel states and can be cut in a variety of meaningful ways. Here, taking a look at the global capesize fleet, we can observe emerging tightness in the market supply in July by looking into the comparative counts of ballast and laden vessels, which through the month of July had been very tight. For the last week of July the count read 534 laden capesize vessels against a ballast count of 561 ballast vessels, indicating more supply in the market.
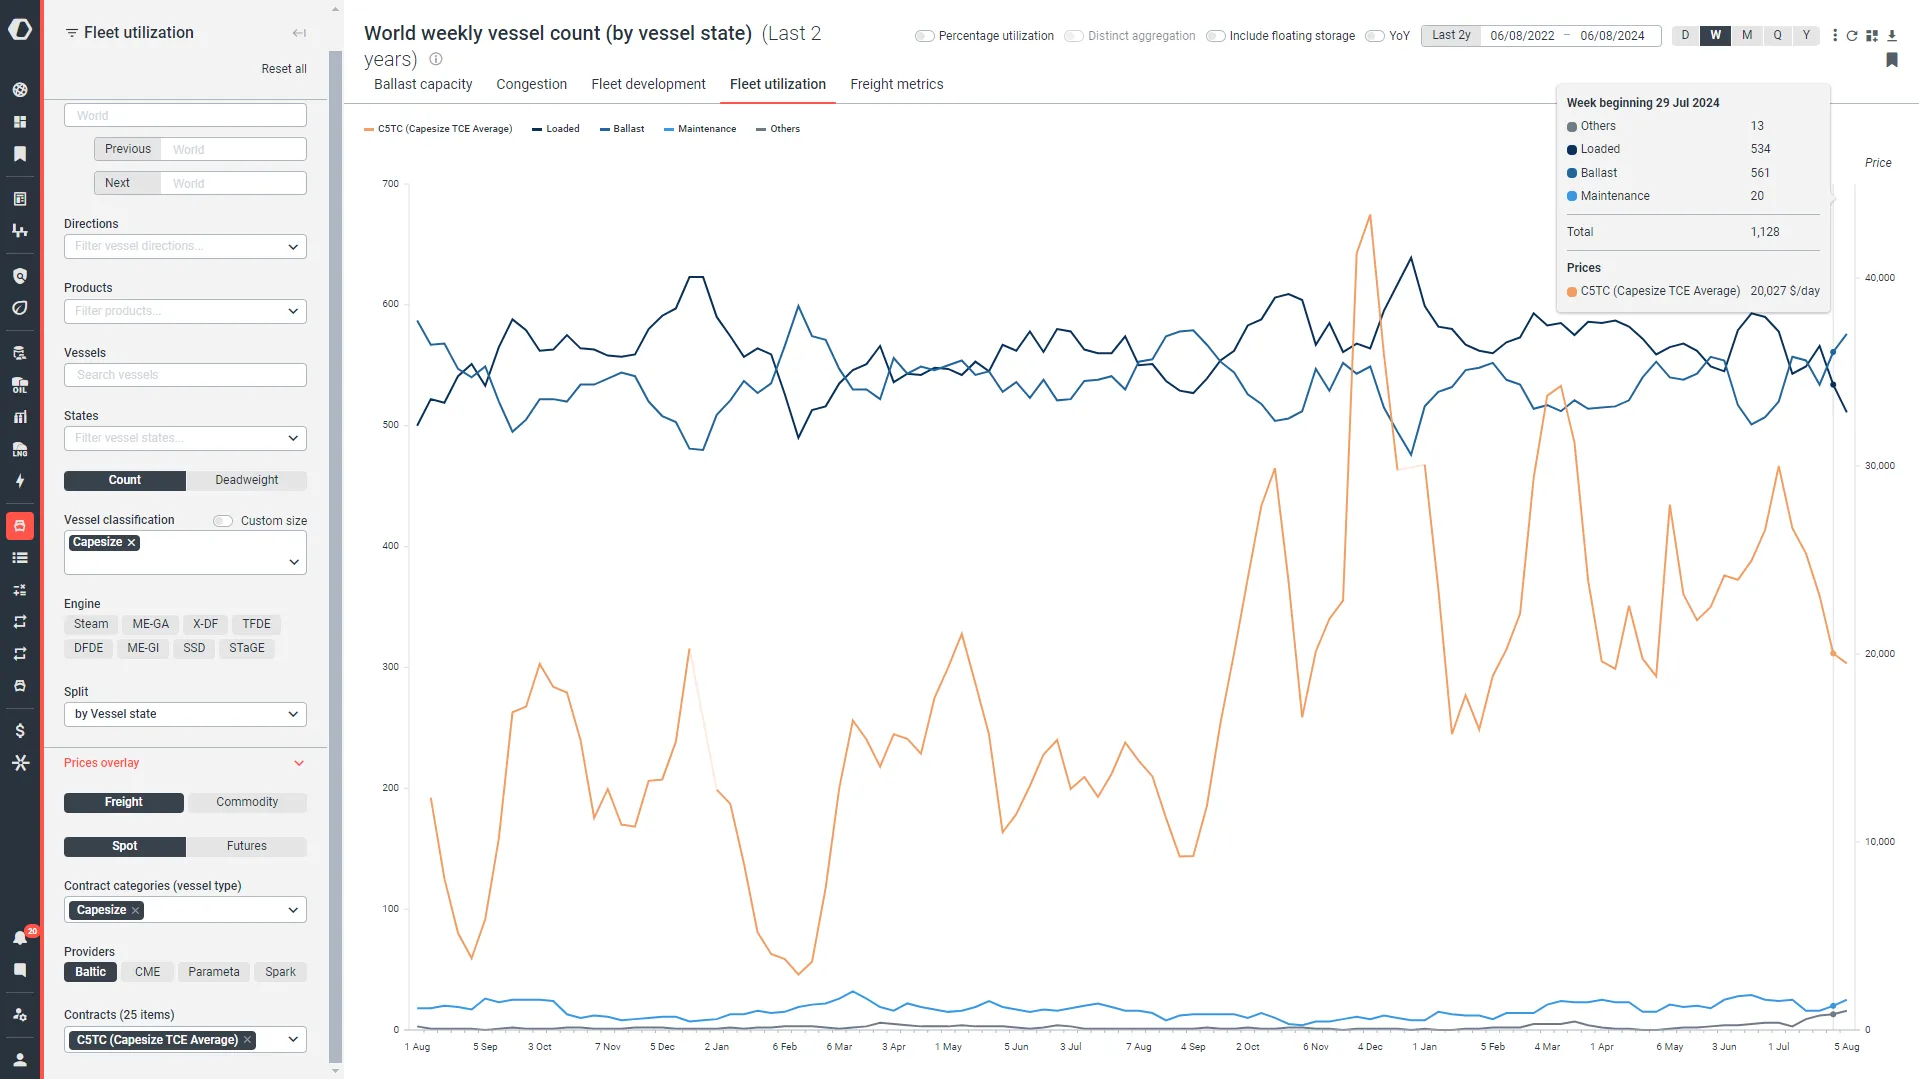
Customers are also able to overlay price on top of fundamentals data in Kpler’s platform. Here, we can observe that the Capesize TCE average has been falling through the month of July, reflecting this tightness in the supply and demand, as the capesize market moves toward a greater number of ballast than laden vessels.
To look further into the reasons behind this trend, we can begin to evaluate some of the typical associated exports to understand where some weakness in the market is appearing. Guinea is the largest bauxite exporter in the world and growing. Bauxite from Guinea is exported more often on Capesize vessels than any other, which can be seen in the data below which looks at Guinea bauxite exports by vessel type, capesizes are almost always taking the most tonnage.

What is notable here is the decline in Bauxite exports in the month of July. Due to the rainy season in Guinea, which runs from June to November, there is less export availability for bauxite - which is now being realized in the associated chartering activity, and lowering the demand for capesize vessels in the Atlantic. Our analyst, Zhiyuan Li, also pointed to this potential shortage in May.
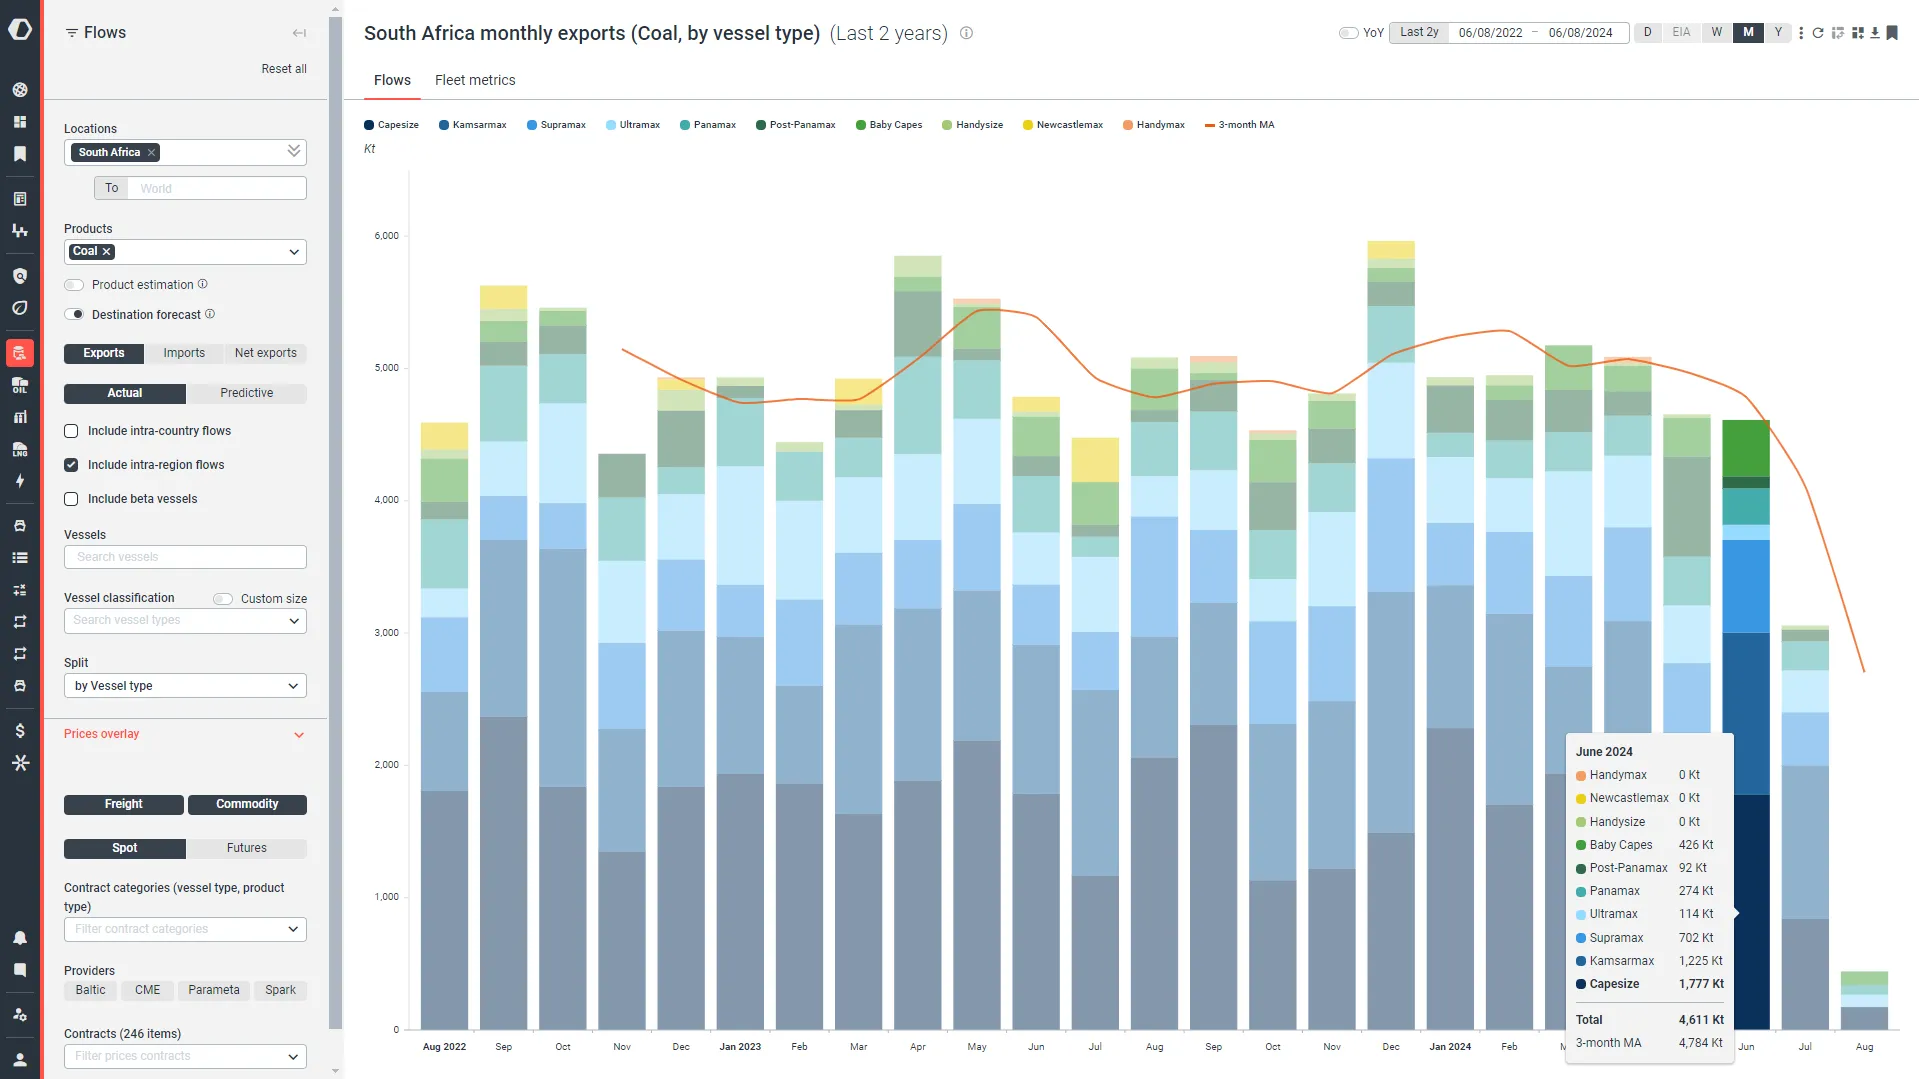
A similar dynamic having an effect on capesize demand is the shortage in exports from South Africa. This as well can be seen clearly in Kpler data, when looking at coal exports from South Africa by vessel types - we see that capesizes are typically carrying a large portion of the tonnage. Here too, we can observe that the volumes of exports have fallen significantly month-over-month from June to July, which has also harmed capesize chartering activity.
By combining freight and commodity flow intelligence, customers are able to observe these trends emerging in real-time and stay ahead of the market in order to avoid risk and maximize their return.
Another important trend which can be observed with Kpler data, is the return of seasonal rains to Panama and its effect on voyages through the Panama canal. Rains have lifted the water level of the Gatun Lake in Panama above 25.70m for the first time since March 2023. This means that the prospect of fresh water locks for vessels to traverse the canal is improving. Water saving restrictions curtailed the flow of dry bulk cargoes through the Canal as an extended drought had seen the level of the lake, a vital source of fresh water for both the Canal locks and the population of Panama, drop below 24.5m in late April.
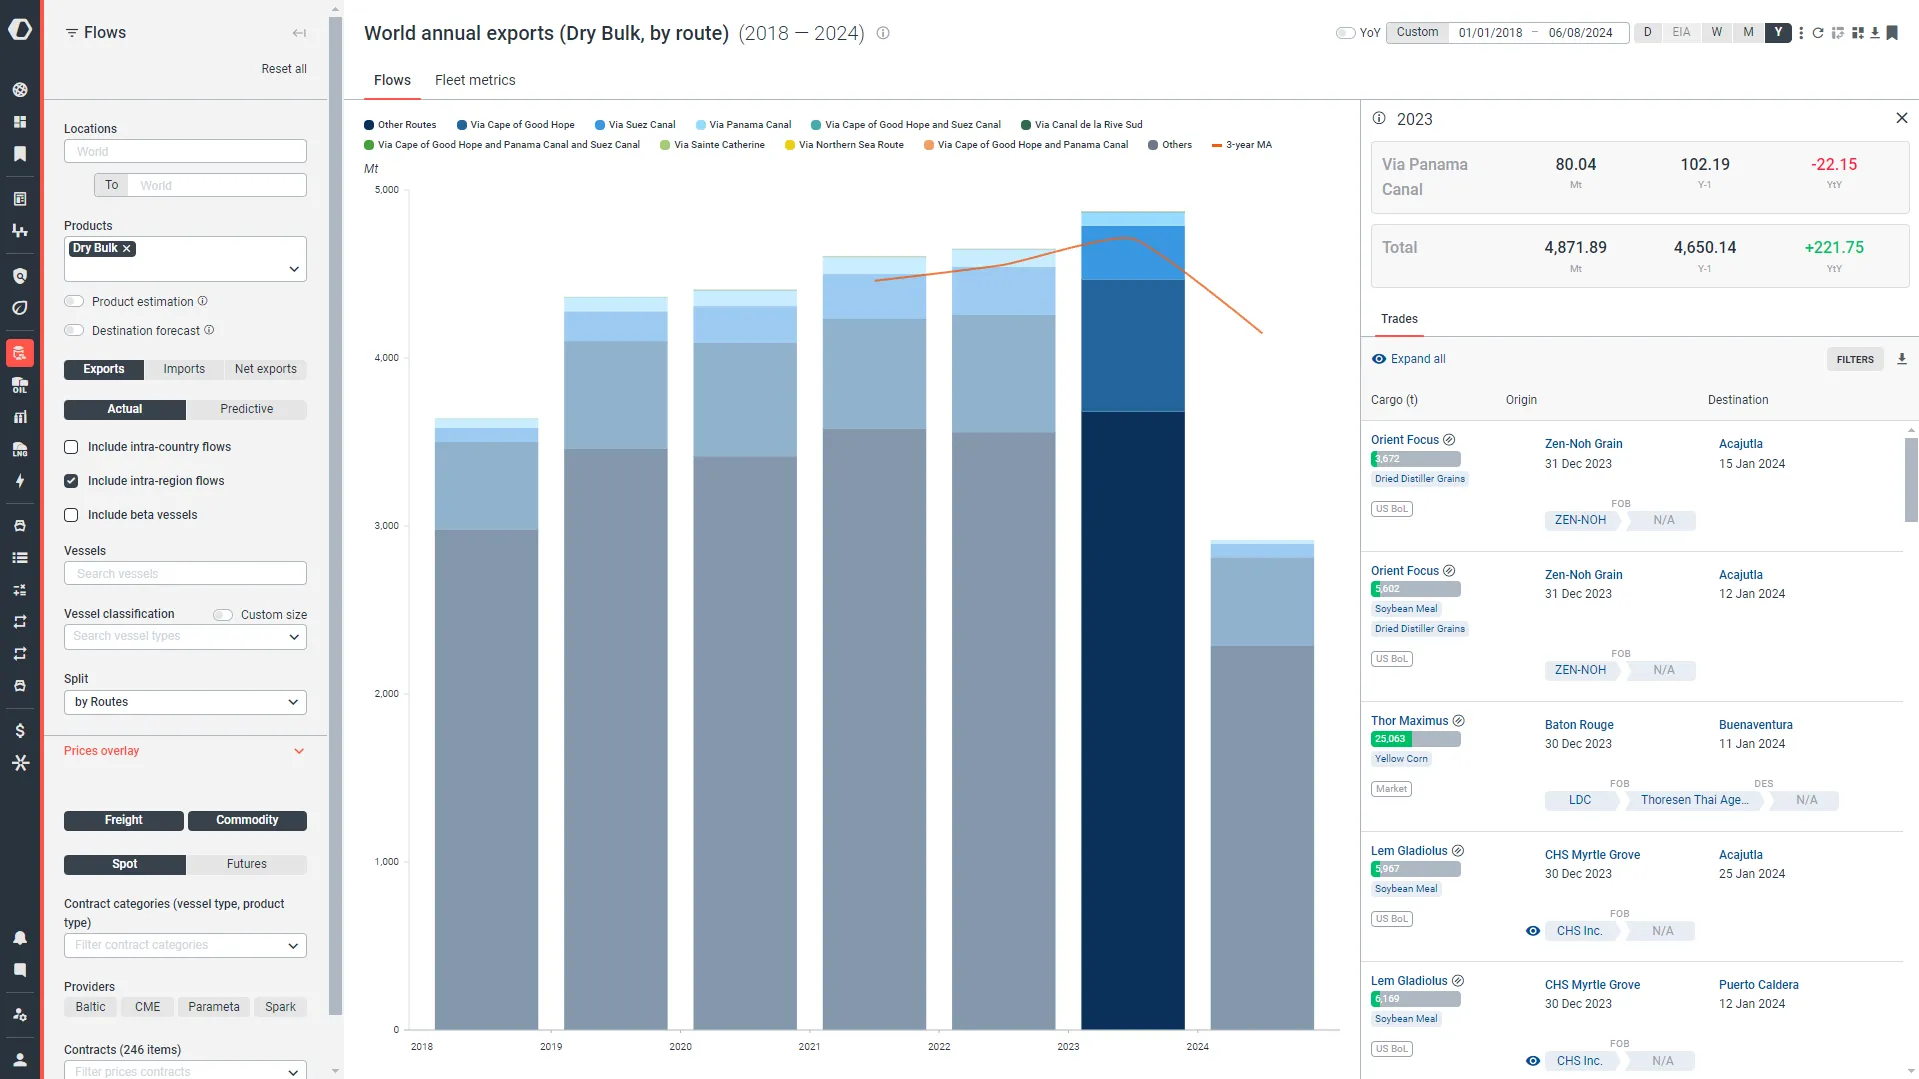
With Kpler, customers are able to look specifically into traffic within canals and observe with detail the cargo that are passing through the Panama canal in real time with a unique split by route. Through this, one can observe that year-over-year the volumes of dry bulk cargo that have passed through the panama canal have reached 22.8 mt whereas last year’s total was 80.04 mt.
The changes in these flows will have a large impact on the freight and chartering activity in the region, and globally. With Kpler you can always stay on top of key commodity market and freight market trends - combining the data across modules in order to reach crucial decisions about where to deploy resources next and keep your business ahead of downside market outcomes.
If you’re not a subscriber, reach out to us below for a demonstration of Kpler’s full suite of data & analytics.

See why the most successful traders and shipping experts use Kpler